IPv4 address pricing has taken varied paths during the past few years. From a five-year perspective, prices have risen dramatically. Recent trends, especially in relative pricing and variations in block-size costs, tell a different story.
Publicly Available IPv4 Pricing Data
The data used in this analysis comes from two sources.
- Transfers are public knowledge, published regularly by Regional Internet Registries (RIRs). Prices charged for those transfers are not public, generally.
- IPv4.Global publishes information about the online platform’s experience – including prices at which transfers occur on its marketplace. This public record began in 2014 and remains unique.
A Brief History
The development of the Internet and the systems that support it are key to IPv4 pricing.
To connect devices privately, each needs a unique identity. To develop the Internet, a device-identification and location system was instituted to do just that. A numbering system was the logical choice. The first version was created in 1973. But the first widely-used version of it, Internet Protocol version Four (IPv4), was designed by ARPA in 1981 and includes about 4.3 billion total possible unique identifying number configurations. In 1981, it seemed unlikely there might ever be more than 4.3 billion Internet devices in use. So, this quantity of identifiers was deemed more than adequate. Of course, now there are tens of billions of connected devices and services.
As the network grew, the central authority on the numbering convention became the Internet Assigned Numbers Authority (IANA). It coordinates many of the core functions of the Internet, including IP addressing, domain name management at a base level, and IP resources. IANA distributed its last IPv4 addresses to the five RIRs in 2011.
IPv4 Exhaustion
The phrase “IPv4 exhaustion” refers to the period when IANA depleted its pool of available IPv4 addresses that could be assigned to RIRs and so thereafter used on connected devices. Of course, the exhaustion of supply at the regional distributors (the RIRs) inevitably followed.
Not long thereafter, APNIC (the Asia-Pacific registry) exhausted all its available IP addresses. RIPE (Europe) ran out in 2012, LACNIC in 2014, and ARIN in 2015. AFRINIC, the African registry, has nearly depleted its supply. It now offers blocks of addresses ranging from /24 (256 addresses) to /22 (1,024 addresses) only to those requesting them. Other RIRs have established waiting lists with varied wait times. Because of this, we can clearly identify one of the most obvious factors that contributes to currently high IPv4 prices: they are in unprecedented short supply.
The New Protocol: IPv6
In response to the pending exhaustion of IPv4 addresses, a task force (the Internet Engineering Task Force – IETF) was formed to respond. In 1995, the IETF delivered IPv6 (Internet Protocol version Six). Its configuration is vastly more expansive than IPv4, as it is built on a 128-bit address layout that permits trillions of trillions of unique addresses. However, while it was created to replace IPv4, adoption of it has been slower than anticipated. Among the challenges to IPv6 adoption is significant conversion costs, conversion and management skill levels, and hardware considerations.
Some older devices simply will not operate using IPv6. Plus, the two protocols are unable to communicate with one another without an intermediary. There are solutions to this problem, but among the impacts of operating the protocols in tandem is that doing so has effectively extended the life of IPv4. So, the two are functioning today across many networks.
It also should be noted that IPv4 is a well-tested, thoroughly mastered protocol that is relatively straightforward and easy to implement and maintain. The broadly-available skill sets needed to install and manage IPv4 addresses and the general familiarity with them has contributed to the continued use of IPv4.
IPv4 Prices and the Expanding Internet
Demand for connectivity, in general, with easy and compatible connections among devices that can be deployed quickly, has grown steadily. So, the challenges of IPv6 have buoyed demand for available IPv4 addresses. Along with demand, and faced with limited supply, marketplaces developed and prices for transfers of addresses have risen.

The Last Decade
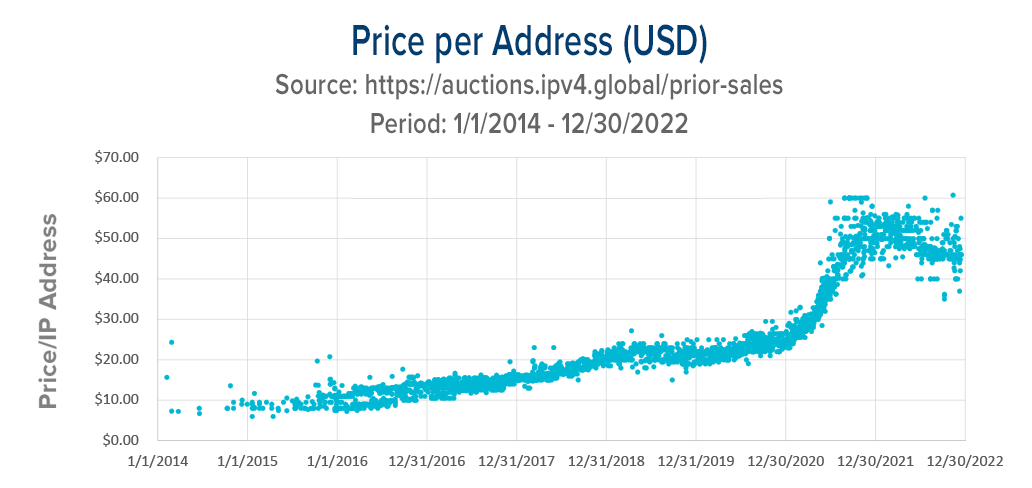
This graph shows IPv4.Global’s online marketplace pricing experience. Because market information is always an influencer of pricing, one can assume this price transparency had an impact. The market’s clear understanding of prices for blocks of all sizes seems to have helped maintain a consistent range of unit prices for the assets. What’s more, prices rose steadily, if relatively slowly, during the following five years.
It should be noted that inflation in the U.S. was generally low during the period 2015-2020. And while prices of IPv4 addresses rose gradually (in comparison to later increases), the rate of growth was nearly 20% per year. IP prices rose from about USD 10 to USD 25 during the period.
IPv4 prices paused their gradual rise in 2019, with various block sizes trading at a slightly wider range of prices. Then, the first half of 2020 saw many existing networks stop their growth as the pandemic swept the world. New networks and network expansion slowed or stopped entirely and along with it the demand for IPv4 addresses.
IPv4 Prices – On the Rise
In early 2021, much of the vaccinated world restarted. New network builds happened and expansions resumed. This clearly produced an increase in demand for IPv4 addresses as their convenience – relative to IPv6 – prevailed.
While demand was rising, the potential supply remained on the sidelines. Renumbering projects didn’t resume quickly so supply was constrained. Many under-used blocks had been deployed using interspersed allocations of addresses, with wide and unwieldy gaps between them. Renumbering to consolidate use and to make contiguous addresses available for sale did not restart quickly. This was, in part, the case because the process can require six months. Plus, networks deploying addresses inefficiently continue to function perfectly well. So, the urgency to renumber them is not great. With demand high and supply constrained, prices rose – rapidly. During 2021, IPv4 prices more than doubled.
Another curious change occurred in 2021. Though pricing remained within a tight band through the first half of the year, at about USD 40 per address, the spread widened. With very short supply, some buyers’ urgency prevailed, and prices rose even faster. Peak pricing reached USD 60 within months. However, given the high cost of the assets, liquidation urgency also increased: holders wanted to monetize quickly. Some of these sellers demanded maximum prices while, apparently, some were willing to sell below market to careful shoppers.
The Price Range Expands
As is evident in the price graph shown, the second half of 2021 produced wildly varied prices for most block sizes. One market essentially became several of them, with buyers’ various needs and different block sizes producing significant price differentials. The many causes of these changes remain uncertain, even though market watchers can identify sources of pricing influence, certainty as the relative impact of those factors can’t be known. The market is too dynamic and too large to permit a conclusive analysis.
Block Size Impacts on Pricing
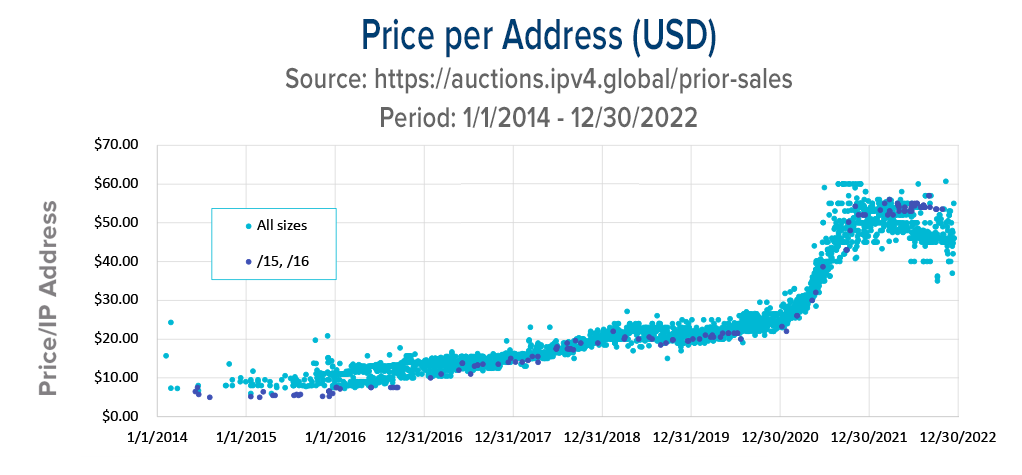
The graph below identifies /15 and /16 (large) block pricing throughout the period in the form of dark spots. For most of the timeframe here (2014 to the first half of 2021), large blocks sold at a significant discount.

One might guess that the administrative chores related to sizable-block needs were most easily – efficiently and cheaply – satisfied with larger blocks. This would, of course, increase their value to those who needed large numbers of addresses. But it appears this influence on pricing was overcome by the relatively high absolute cost of a large block and/or the scarcity of buyers for them. Regardless of the various influences on large block prices, they remained relatively low throughout this period.
However, the discount for these large blocks created an unusual opportunity in a commodities market like IPv4. A large bundle of addresses was cheaper per IP address than the same total quantity, subdivided. During 2021, larger sellers and savvy traders in these large-block assets began to break them up and sell the addresses in smaller, more costly-per-IP batches.
IPv4 Block Price Inversion
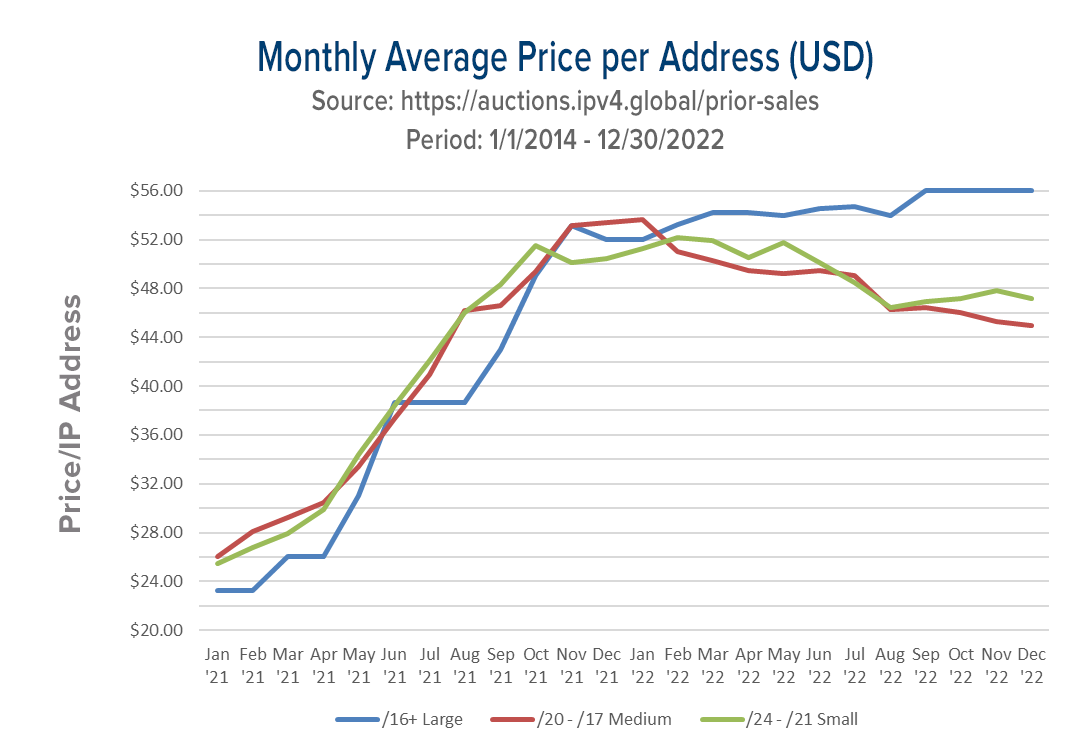
Today, sellers can expect a higher price-per-address for larger blocks. As noted, the cause of this inversion from recent history cannot be fully known. But it makes sense in terms of scarcity: we know there are more /18s than /16s. Prosperous, aggressive operations in online retail, communications, and cloud-based services are growing rapidly and profitably. As a result, the urgency to accumulate IP addresses is acute and their value to operations very high.

Theoretically, a buyer could piece together smaller blocks and resell them as a “bundle” functionally equivalent to one of the bigger blocks (/16 or more). But these cobbled-together bundles of blocks are less desirable to bigger companies since the IP addresses that compose them are not digitally sequential and so present numbering issues.
Global Trends
One thing is undeniable: 2022 was a year of some trepidation on the part of businesses as inflation concerns raised interest rates and recession became a worry. The anticipated slowing of the economy – and especially that of the technology sector in general – caused many companies to reduce their investments.
This is the case because any networking infrastructure investment is likely to be a long-term one since the build-out of these investments is often extended and the benefit is delayed. All of which means the expense is current and the improved efficiency or opportunity is deferred. So, the sagging economy in connection with rising energy costs, a war, and the global pandemic surely dampened investment in all infrastructure. So, network growth plans have (and continue to) take a hit as a result. The relative effect of this pull-back can’t be measured and its duration is unknowable.
In a nearly-pure commodities market like that of IPv4, one might expect demand to play a very significant role. However, the global economy notwithstanding, transfer volumes at both RIPE and ARIN (Europe and North America) increased significantly 2022 over 2021. Transfer records show that, worldwide, non-merger and acquisition transfers increased approximately 35% one year over the next.
Routing Table Growth
New entries to IPv4 and IPv6 routing tables indicate the overall growth of those networks worldwide. In both cases, growth slowed in 2022 significantly and at about the same rate. This slowing, considering the expanded transfer rates worldwide, is surprising. Plus, the similarity of the rate of change in the two routing tables suggests that some factor is at work other than IPv4 market decline. Put simply, IPv6 deployment rate slowing can’t be over-extended or saturated networks and so shrinking markets. IPv6 is far from a saturated market and so other influences must be in effect. Because IPv4 mirrors the slowing of IPv6, one is inclined to believe they are being influenced by similar factors.
In Sum
Any summaries here are necessarily inconclusive. The influences on pricing in the IPv4 market are clearly at cross-currents with one another. Marketplaces are strong and infrastructure expansion has undoubtedly slowed, if only temporarily. How deep an economic decline may occur and how long it may last remains unknown. How and if that macro-economic impact will impact IPv4 markets is also anyone’s guess.


